Custom Queries
Finding the right answer to your errors starts with asking the right query.
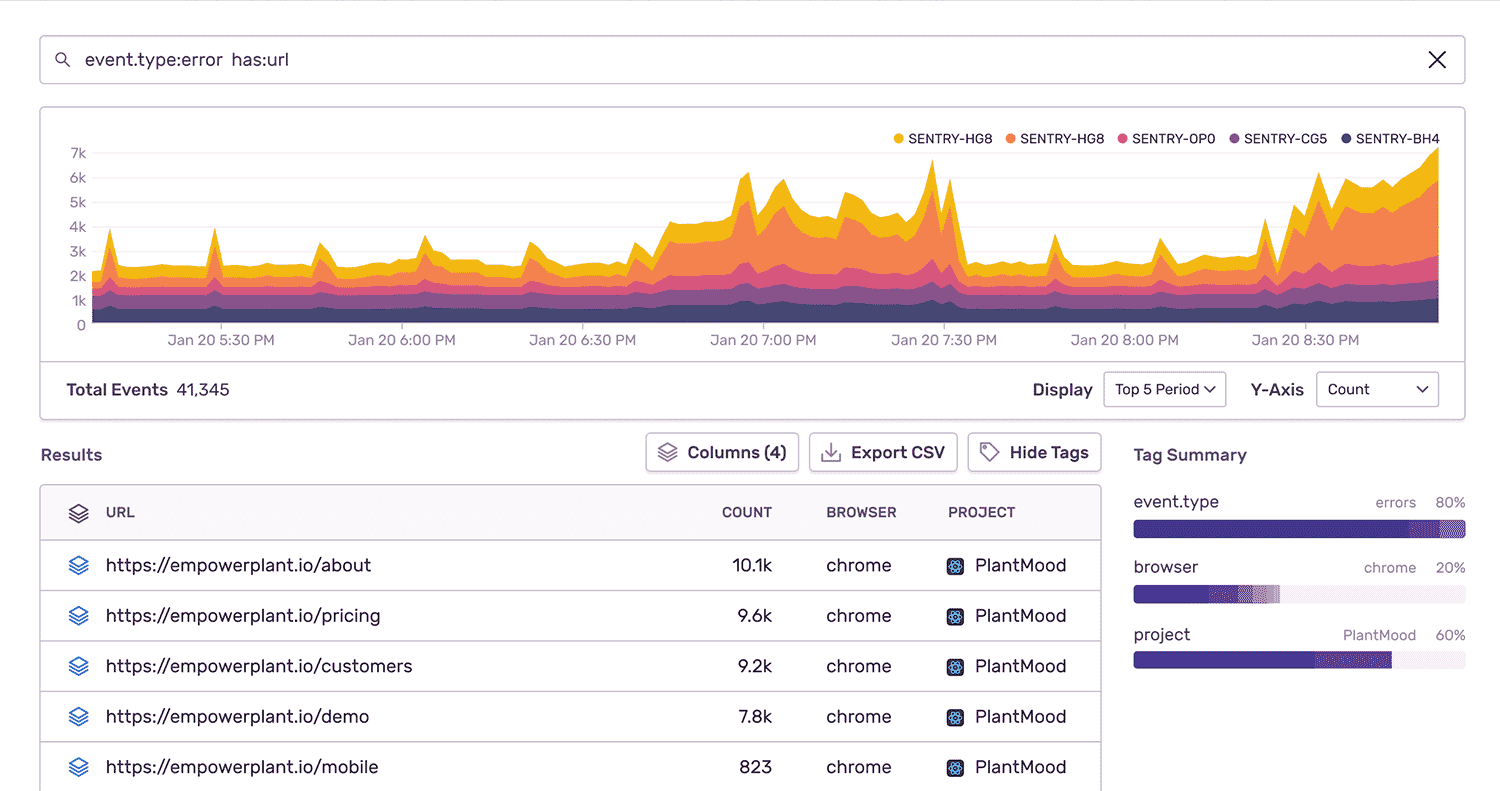
With Custom Queries in Discover, you’re able to get to the root cause of an error
in ways that pre-built queries can’t.

Don’t just sort your data, shape it
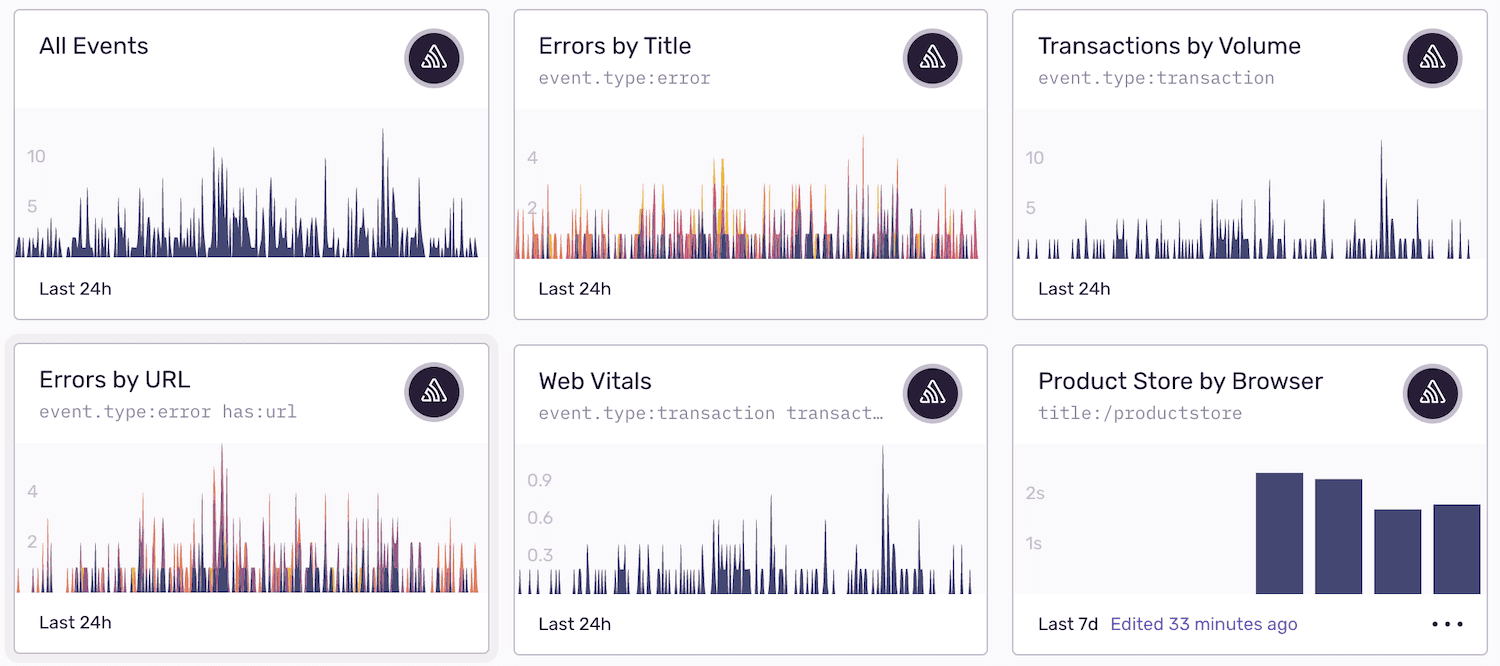
Build and share custom views to keep a pulse on the most critical parts of your business. Correlate release health with latency and alert spike to learn where to focus engineering effort. Track release frequency, version quality over time, issues by customer or region, or literally anything you can query.

Triage. Resolve. Relax.
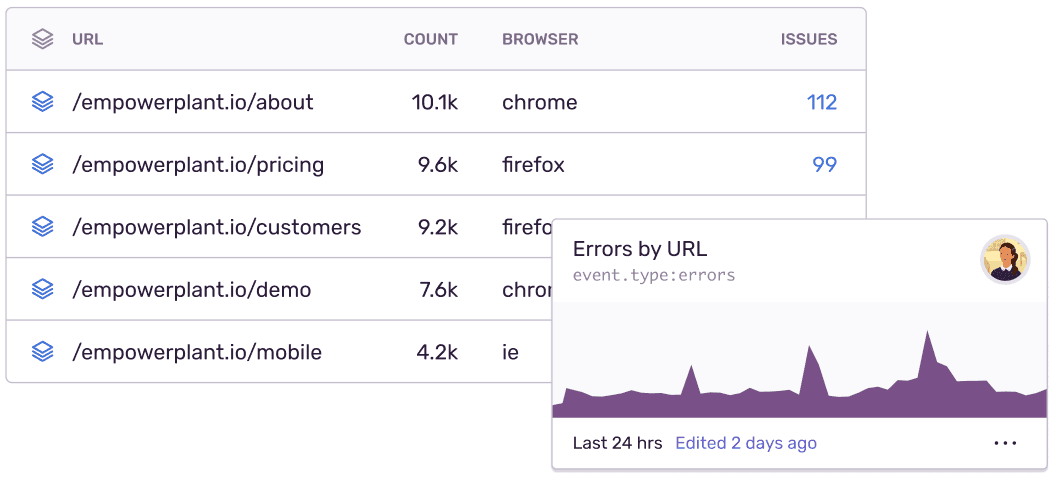
Custom Queries help you determine which parts of your code are directly responsible for the most errors or which locations are encountering the most problems. For example, Custom Query histograms can segment errors on certain users, so you can see whether multiple conditions contribute to an issue. And you can receive real-time alerts based on any custom query you construct.

An extra dimension of visibility
With Discover, you can navigate through the results of your error or performance queries across multiple projects. And with our interactive query map, you can distribute your custom data across a variety of Y-Axis filters: Count, Average Transaction Duration, Unique User Count and much more.
We do other cool things too
A peek at your privacy
Here’s a quick look at how Sentry handles your personal information (PII).
×Who we collect PII from
We collect PII about people browsing our website, users of the Sentry service, prospective customers, and people who otherwise interact with us.
What if my PII is included in data sent to Sentry by a Sentry customer (e.g., someone using Sentry to monitor their app)? In this case you have to contact the Sentry customer (e.g., the maker of the app). We do not control the data that is sent to us through the Sentry service for the purposes of application monitoring.
Am I included?PII we may collect about you
- PII provided by you and related to your
- Account, profile, and login
- Requests and inquiries
- Purchases
- PII collected from your device and usage
- PII collected from third parties (e.g., social media)
How we use your PII
- To operate our site and service
- To protect and improve our site and service
- To provide customer care and support
- To communicate with you
- For other purposes (that we inform you of at collection)
Third parties who receive your PII
We may disclose your PII to the following type of recipients:
- Subsidiaries and other affiliates
- Service providers
- Partners (go-to-market, analytics)
- Third-party platforms (when you connect them to our service)
- Governmental authorities (where necessary)
- An actual or potential buyer
We use cookies (but not for advertising)
- We do not use advertising or targeting cookies
- We use necessary cookies to run and improve our site and service
- You can disable cookies but this can impact your use or access to certain parts of our site and service
Know your rights
You may have the following rights related to your PII:
- Access, correct, and update
- Object to or restrict processing
- Port over
- Opt-out of marketing
- Be forgotten by Sentry
- Withdraw your consent
- Complain about us
If you have any questions or concerns about your privacy at Sentry, please email us at compliance@sentry.io.
If you are a California resident, see our Supplemental notice.