Flask Error Monitoring
Actionable insights to resolve Flask performance bottlenecks and errors. Improve your monitoring workflow with a full view of releases so you can mark Flask errors as resolved and prioritize live issues.
Getting Started is Simple
Install sentry-sdk from PyPI with the flask extra:
pip install --upgrade 'sentry-sdk[flask]'
Configure your DSN:
import sentry_sdk
from flask import Flask
from sentry_sdk.integrations.flask import FlaskIntegration

sentry_sdk.init(
    dsn="https://<key>@sentry.io/<project>",
    integrations=[FlaskIntegration()],

    # Set traces_sample_rate to 1.0 to capture 100%
    # of transactions for Tracing.
    # We recommend adjusting this value in production,
    traces_sample_rate=1.0
)

app = Flask(__name__)
Check our documentation for the latest instructions.
See all platformsMore than 130K Organizations Trust Sentry with Their Application Monitoring

Flask Performance Monitoring
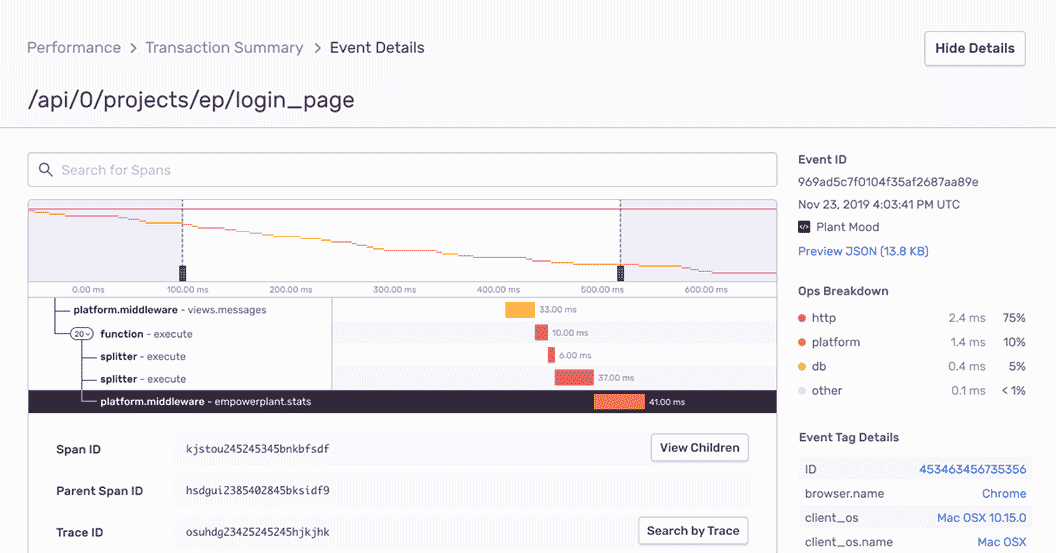
Within minutes after installing Sentry, software teams are able to trace Flask performance issues back to a poor performing API call as well as surface all related code errors. Engineering Managers and Developers now have a single tool to optimize performance of their code and deliver fast customer experiences with Performance Monitoring.

Flask Error Monitoring with Complete Stack Traces
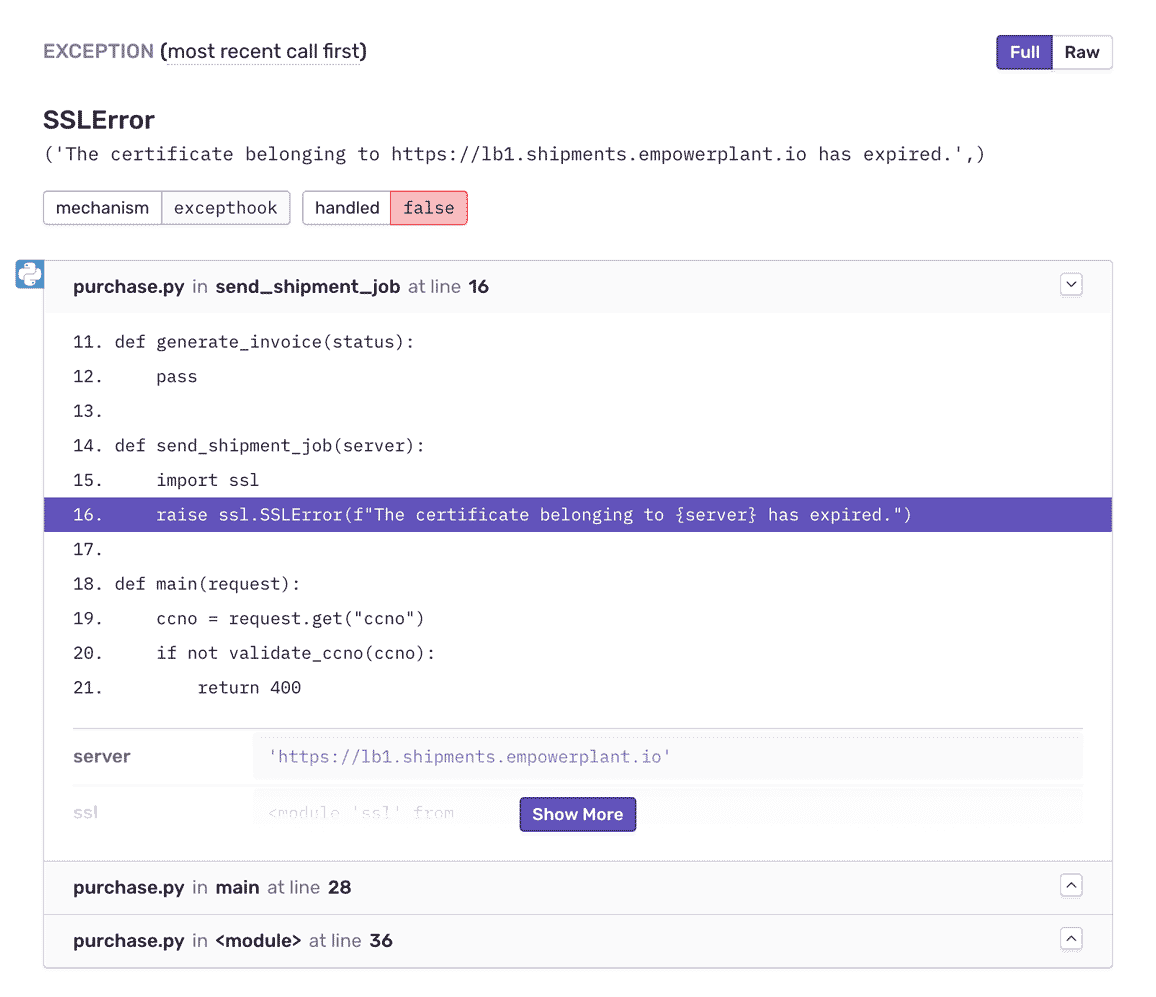
See local variables in the stack for prod errors, just like in your dev environment. Introspect more deeply into the runtime and jump into the frame to get additional data for any local variable. Filter and group Flask exceptions intuitively to eliminate noise.

Fill In the Blanks About Flask Errors
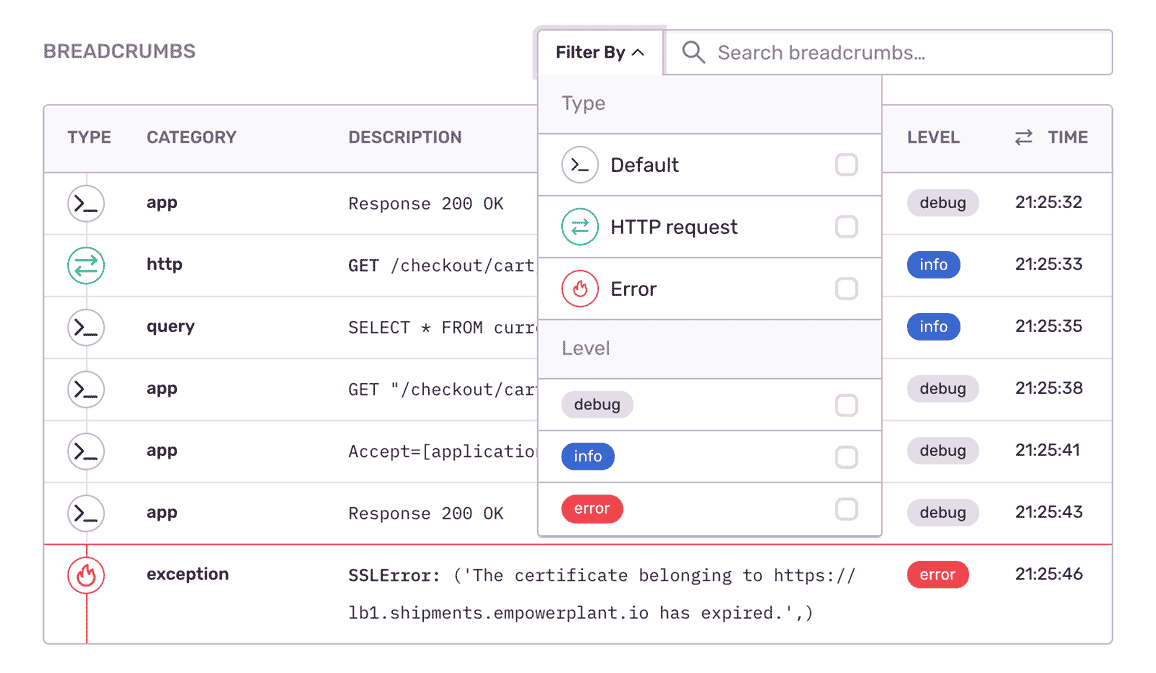
Expose the important events that led to each Flask exception: SQL queries, debug logs, network requests, past errors. Learn in which version a bug first appeared, merge duplicates, and know if things regress in a future release.
Sentry helps our team fix the most important issues in each release.”
See the Full Picture of Any Flask Exception
Aggregate errors by details like HTTP request, hostname, and app version to see what’s new, a priority, or a trend.
Assign custom tags to reproduce the error environment specific to your application, business, and users.
Find answers to key questions: How actionable is this error? In which app release did the Flask bug occur?
FAQs
Sentry supports every major language, framework, and library. You can browse each of them here.
You can get started for free. Pricing depends on the number of monthly events, transactions, and attachments that you send Sentry. For more details, visit our pricing page.
Sentry doesn’t impact a web site’s performance.
If you look at the configuration options for when you initialize Sentry in your code, you’ll see there’s nothing regarding minimizing its impact on your app’s performance. This is because our team of SDK engineers already developed Sentry with this in mind.
Sentry is a listener/handler for errors that asynchronously sends out the error/event to Sentry.io. This is non-blocking. The error/event only goes out if this is an error.
Global handlers have almost no impact as well, as they are native APIs provided by the browsers.
Supporting Resources
Resolve Flask errors with max efficiency, not max effort
A peek at your privacy
Here’s a quick look at how Sentry handles your personal information (PII).
×Who we collect PII from
We collect PII about people browsing our website, users of the Sentry service, prospective customers, and people who otherwise interact with us.
What if my PII is included in data sent to Sentry by a Sentry customer (e.g., someone using Sentry to monitor their app)? In this case you have to contact the Sentry customer (e.g., the maker of the app). We do not control the data that is sent to us through the Sentry service for the purposes of application monitoring.
Am I included?PII we may collect about you
- PII provided by you and related to your
- Account, profile, and login
- Requests and inquiries
- Purchases
- PII collected from your device and usage
- PII collected from third parties (e.g., social media)
How we use your PII
- To operate our site and service
- To protect and improve our site and service
- To provide customer care and support
- To communicate with you
- For other purposes (that we inform you of at collection)
Third parties who receive your PII
We may disclose your PII to the following type of recipients:
- Subsidiaries and other affiliates
- Service providers
- Partners (go-to-market, analytics)
- Third-party platforms (when you connect them to our service)
- Governmental authorities (where necessary)
- An actual or potential buyer
We use cookies (but not for advertising)
- We do not use advertising or targeting cookies
- We use necessary cookies to run and improve our site and service
- You can disable cookies but this can impact your use or access to certain parts of our site and service
Know your rights
You may have the following rights related to your PII:
- Access, correct, and update
- Object to or restrict processing
- Port over
- Opt-out of marketing
- Be forgotten by Sentry
- Withdraw your consent
- Complain about us
If you have any questions or concerns about your privacy at Sentry, please email us at compliance@sentry.io.
If you are a California resident, see our Supplemental notice.