Node Error and Performance Monitoring
Actionable insights to resolve Node performance bottlenecks and errors. Improve your Node monitoring workflow with a full view of releases so you can mark errors as resolved and prioritize live issues.
Getting Started is Simple
Grab the Sentry Node SDK:
npm install @sentry/node
Configure your SDK:
const Sentry = require('@sentry/node');
Sentry.init({ dsn: 'https://<key>@sentry.io/<project>' });
Check our documentation for the latest instructions.
See all platformsHow to install the Node SDK

Powered by OpenTelemetry
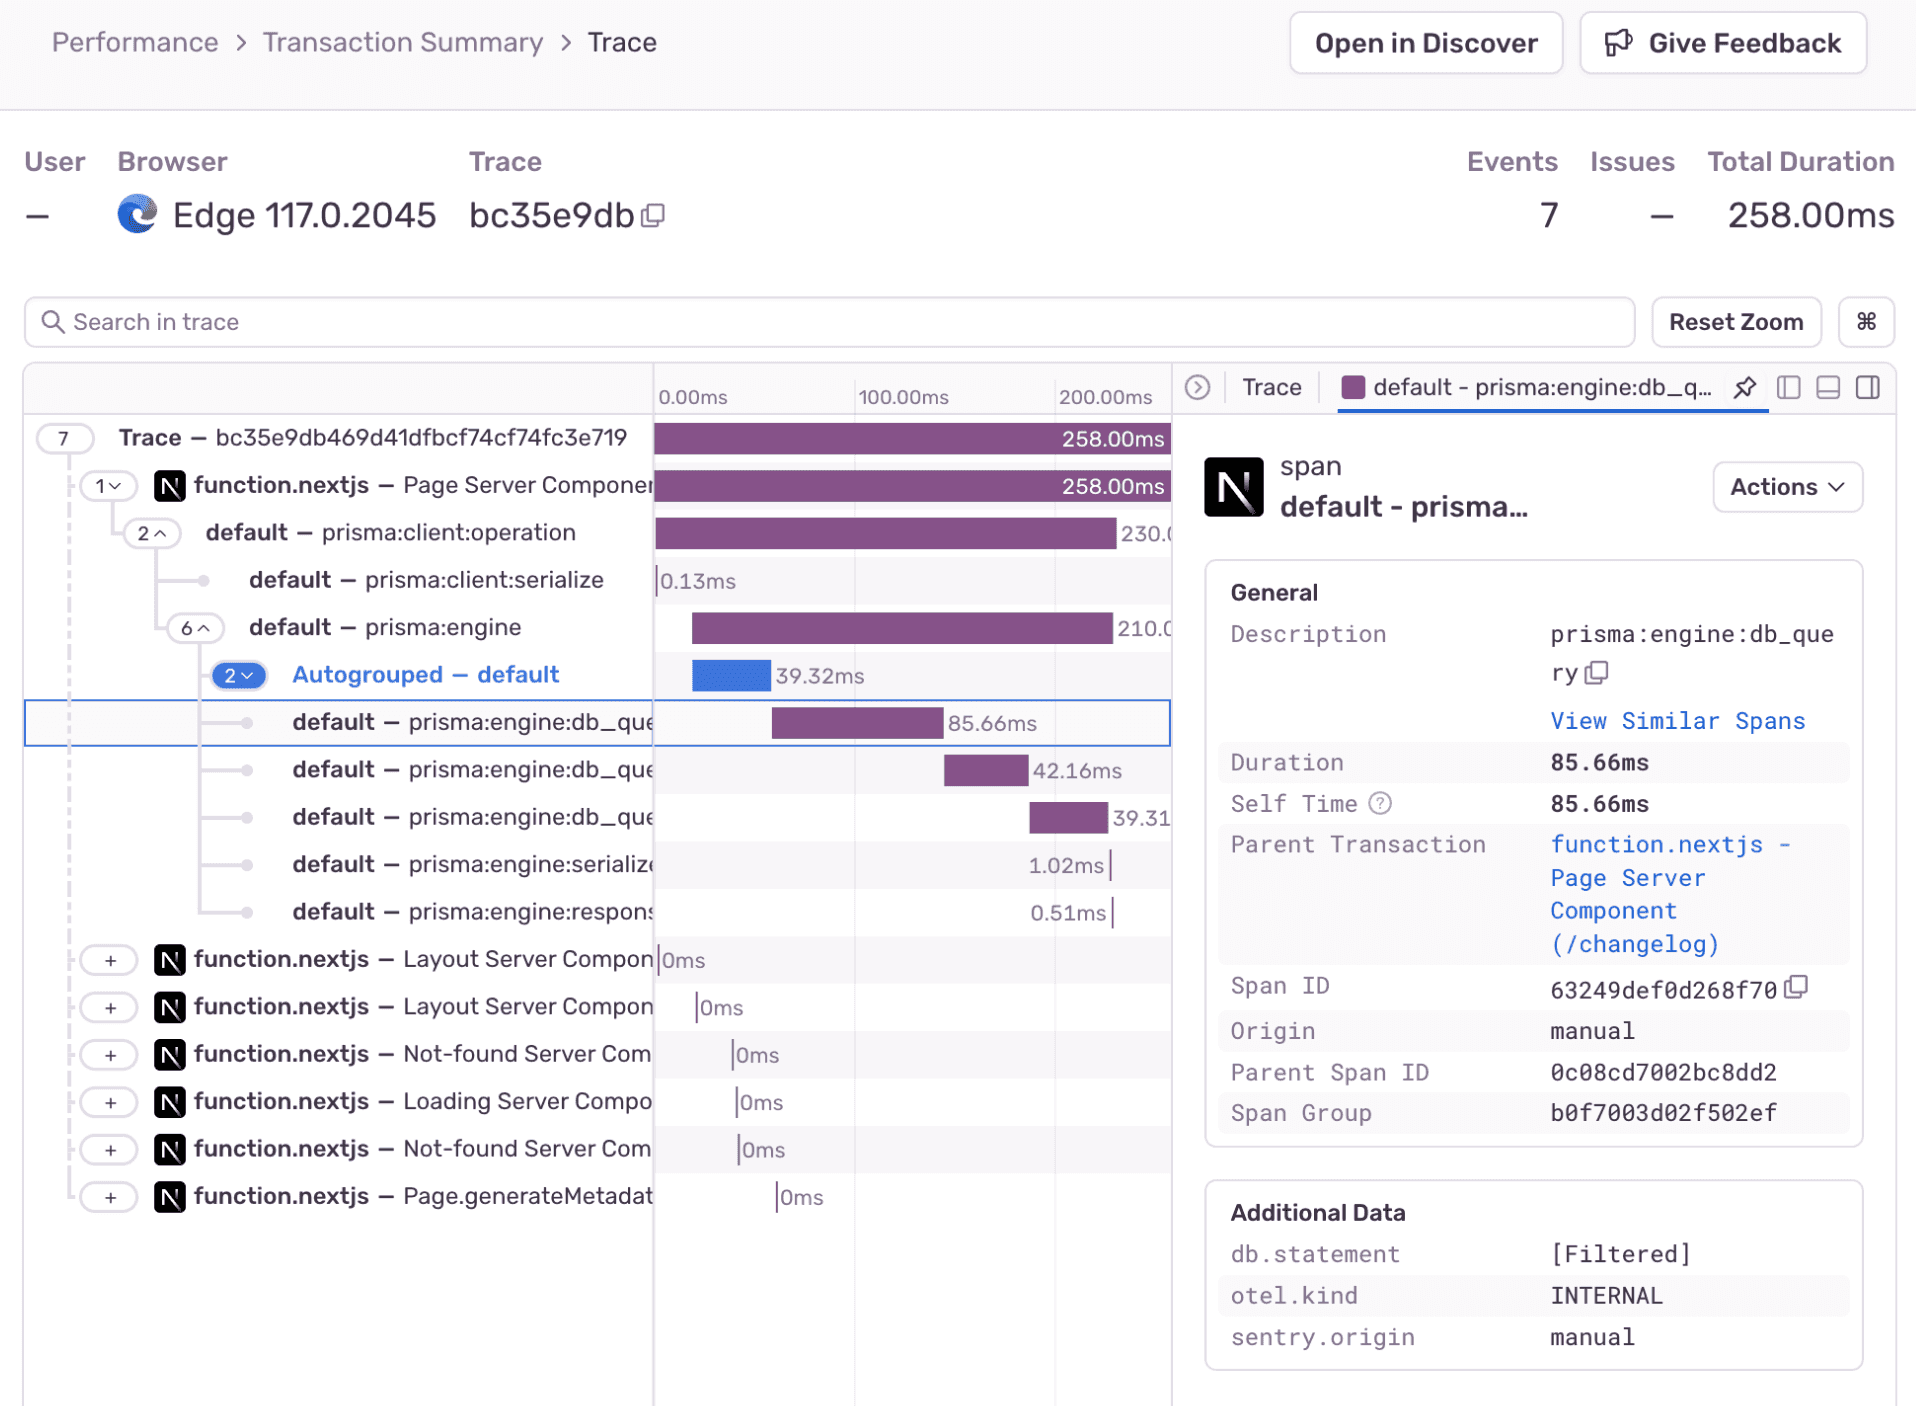
Sentry works with OpenTelemetry to provide a simple configuration process, and rich distributed tracing context across all the libraries and frameworks used in your application. Regardless of your chosen tech stack.

Node Performance Monitoring
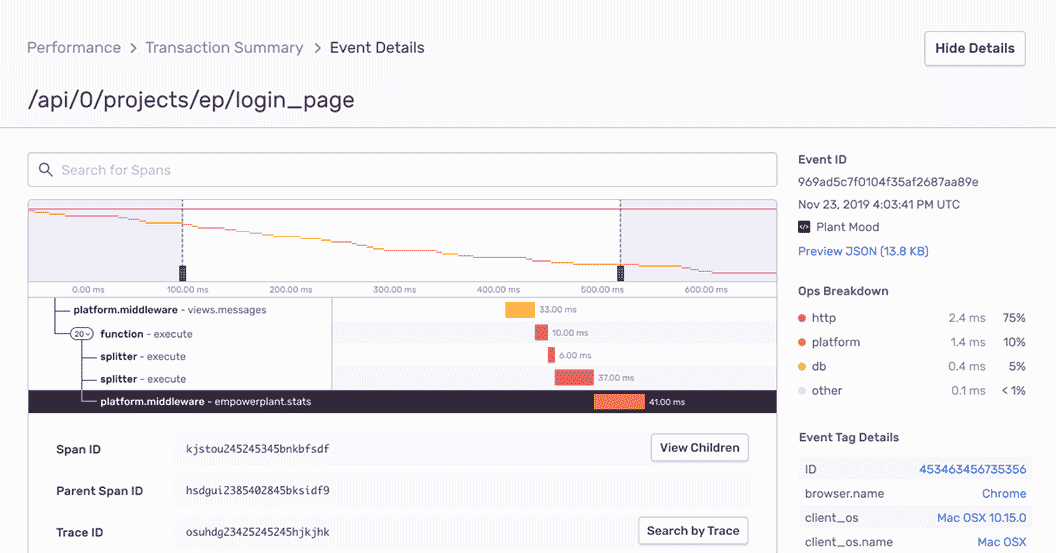
Quickly identify Node performance issues and view full end-to-end distributed trace to see the exact, poor-performing API call and surface any related errors.

Node Error Monitoring with Complete Stack Traces
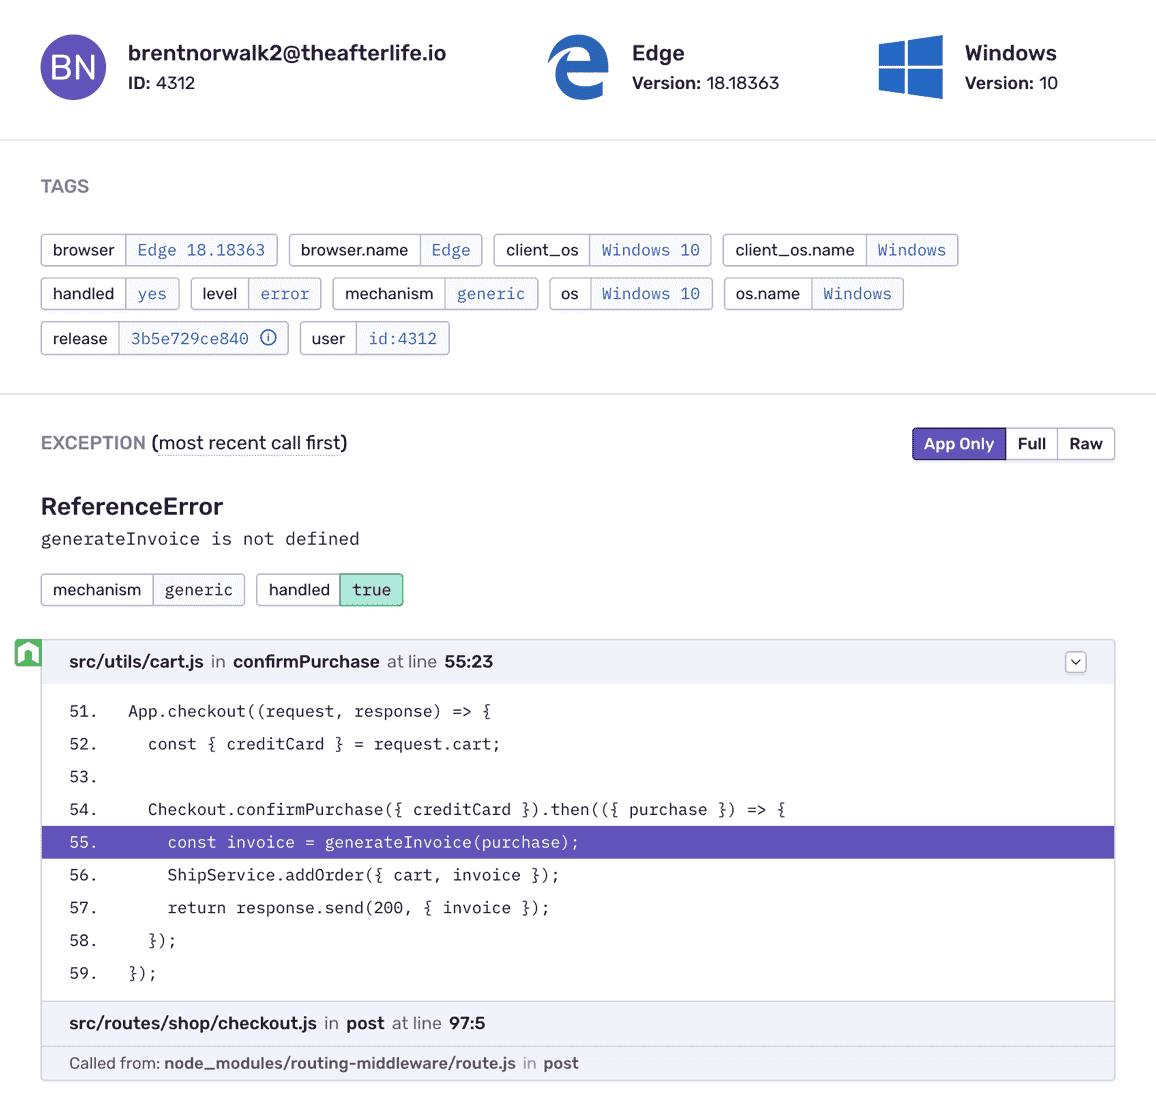
See the Node source code at each frame instead of settings for just line and column numbers. Get proper asynchronous context tracking — like thread-local store — in a way that fits Node’s concurrency model.

Fill In The Blanks About Node Errors
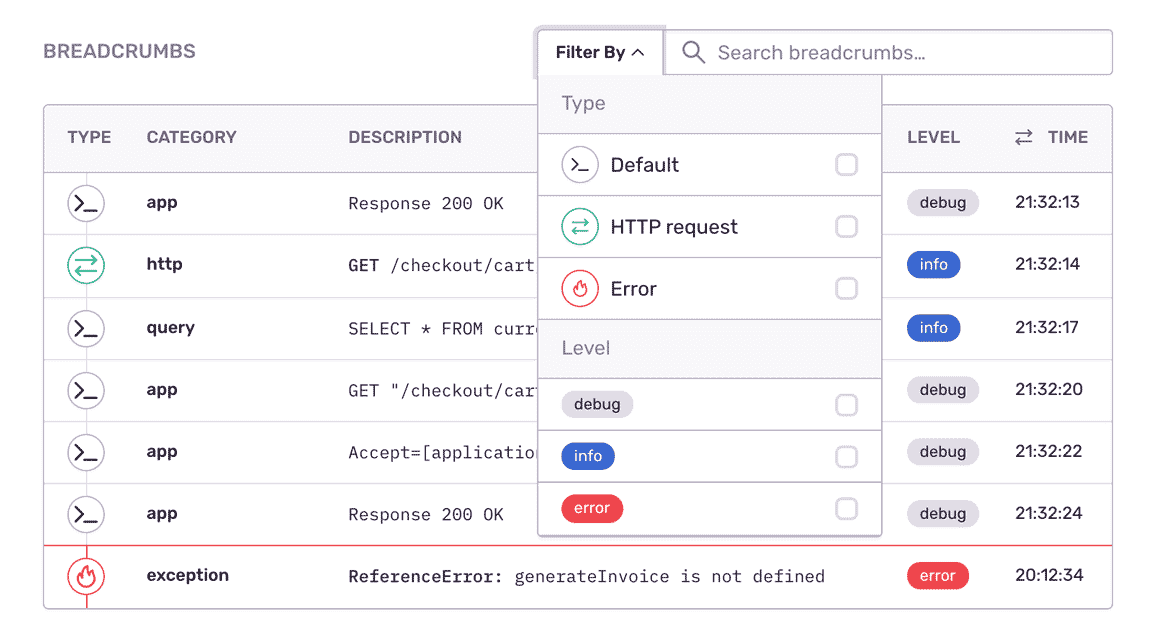
See what the app was doing when the Node error occurred: HTTP requests, database queries, console loft statements, etc.
Node Application Profiling
Profiling lets you see what parts of your code are consuming the most resources, like CPU or memory, in your application— so you can optimize them before end user experience is impacted. Test your application performance in any environment, including in production, without writing manual tests or extensive troubleshooting.
Try Profiling“Sentry’s high-quality tooling helps Disney+ maintain high-quality service to its tens of millions of global subscribers.”
Debugging Any Node Exception
Aggregate errors by factors like request details, user ID, and event level to see what’s new, a priority, or a trend.
Assign custom key-value tags to reproduce the error environment specific to your application, business, and users.
Find answers to key questions: Has an error with the same stack occurred before? In which app release did the Node bug occur?
It’s why companies that don’t have a complete view of their infrastructure are being punished:
The average cost of network downtime is around $5,600 per minute — or $300,000 per hour.
1 out of 5 online shoppers will abandon their cart because the transaction process was too slow.
On average, a two-second slowdown in page load decreases revenues by 4.3 percent.
FAQs
Sentry supports every major language, framework, and library. You can browse each of them here.
You can get started for free. Pricing depends on the number of monthly events, transactions, and attachments that you send Sentry. For more details, visit our pricing page.
Sentry doesn’t impact a web site’s performance.
If you look at the configuration options for when you initialize Sentry in your code, you’ll see there’s nothing regarding minimizing its impact on your app’s performance. This is because our team of SDK engineers already developed Sentry with this in mind.
Sentry is a listener/handler for errors that asynchronously sends out the error/event to Sentry.io. This is non-blocking. The error/event only goes out if this is an error.
Global handlers have almost no impact as well, as they are native APIs provided by the browsers.
Supporting Resources
A better experience for your users. An easier life for your developers.
A peek at your privacy
Here’s a quick look at how Sentry handles your personal information (PII).
×Who we collect PII from
We collect PII about people browsing our website, users of the Sentry service, prospective customers, and people who otherwise interact with us.
What if my PII is included in data sent to Sentry by a Sentry customer (e.g., someone using Sentry to monitor their app)? In this case you have to contact the Sentry customer (e.g., the maker of the app). We do not control the data that is sent to us through the Sentry service for the purposes of application monitoring.
Am I included?PII we may collect about you
- PII provided by you and related to your
- Account, profile, and login
- Requests and inquiries
- Purchases
- PII collected from your device and usage
- PII collected from third parties (e.g., social media)
How we use your PII
- To operate our site and service
- To protect and improve our site and service
- To provide customer care and support
- To communicate with you
- For other purposes (that we inform you of at collection)
Third parties who receive your PII
We may disclose your PII to the following type of recipients:
- Subsidiaries and other affiliates
- Service providers
- Partners (go-to-market, analytics)
- Third-party platforms (when you connect them to our service)
- Governmental authorities (where necessary)
- An actual or potential buyer
We use cookies (but not for advertising)
- We do not use advertising or targeting cookies
- We use necessary cookies to run and improve our site and service
- You can disable cookies but this can impact your use or access to certain parts of our site and service
Know your rights
You may have the following rights related to your PII:
- Access, correct, and update
- Object to or restrict processing
- Port over
- Opt-out of marketing
- Be forgotten by Sentry
- Withdraw your consent
- Complain about us
If you have any questions or concerns about your privacy at Sentry, please email us at compliance@sentry.io.
If you are a California resident, see our Supplemental notice.