Whether it’s a little lag or a 404 message at checkout (yikes), an application performance monitoring platform like Sentry not only tells you when frontend errors happen, but the who, what, and where behind them.
This post is a crash (pun intended) course on Sentry frontend error monitoring using a simple React app.
We’ll cover the set up process, how to un-minify the stack trace by uploading source maps, view video-like reproductions of user sessions with Session Replay, and explain how to see if a frontend error is related to a backend one.
Before we dive in, let’s talk about the demo app.
The sample project is React based with a Vite bundler.
We previously set up a backend project to show how distributed tracing works - but don't worry, this won't affect how Sentry is instrumented for the frontend.
If you want to play along with the exact app we're using for the demo, you can access the project on GitHub.
Note as this sample project isn’t officially supported by Sentry, we are hosting the GitHub repo outside of the Sentry repo and the repo is named “Quicksnark” (because we’re punny).
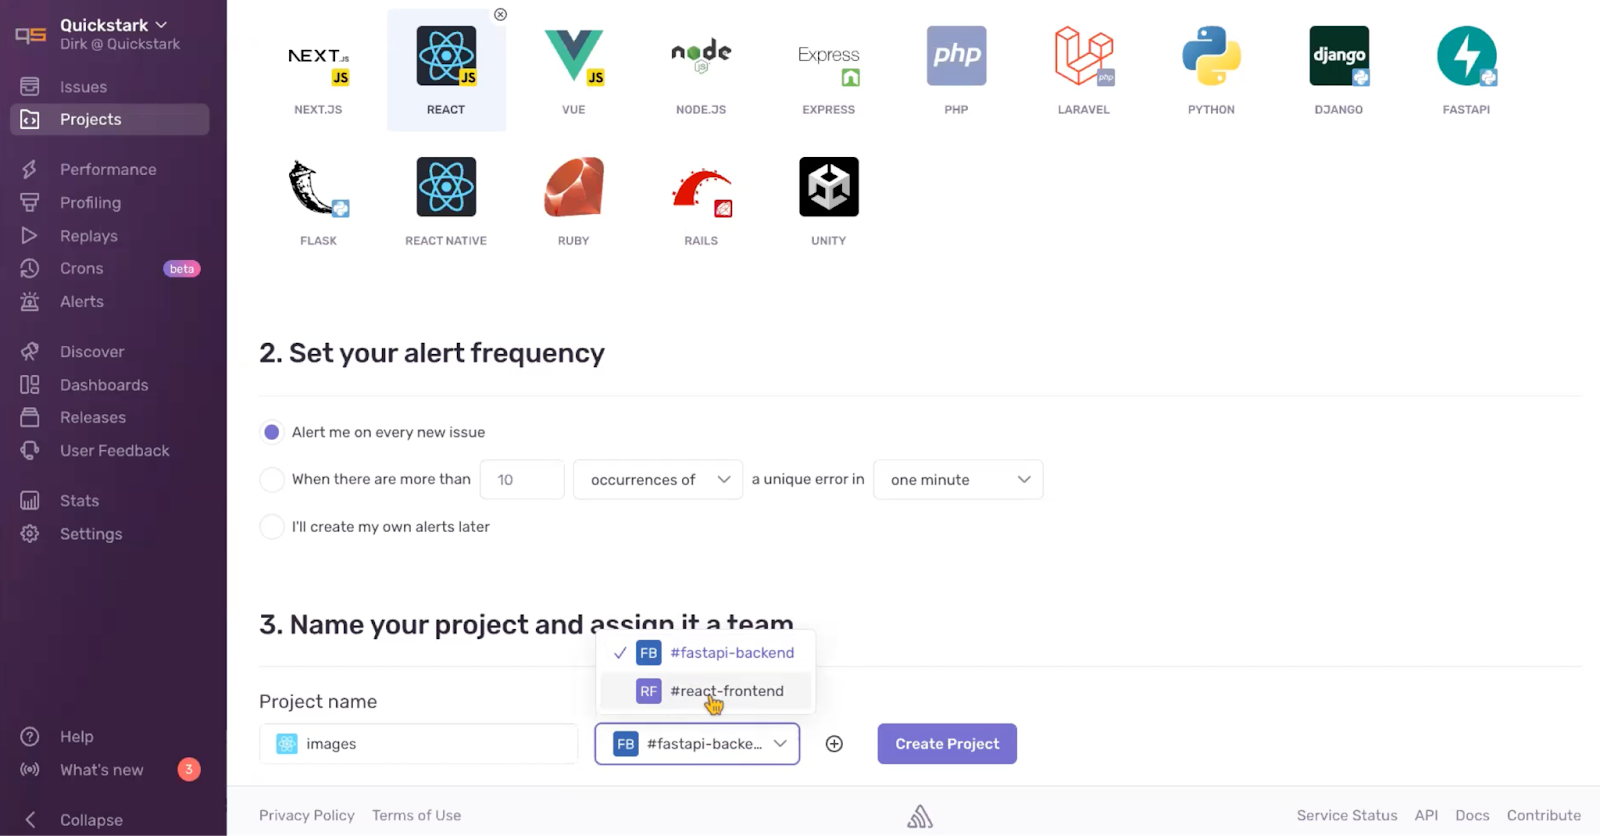
If you already have a Sentry organization, great. If not, you can create one here. Before you start following along with your project, you’ll need to integrate your source code with Sentry. We’re using GitHub, but Sentry also supports BitBucket, Azure DevOps and GitLab. After you’ve created your org and integrated your source code, you will need to create a project. In Sentry, go to the Projects tab, click Create Project and select the project’s platform/SDK. While we could select Browser JavaScript, selecting the exact flavor of JavaScript we’re using, in this case React, is going to help provide context about the platform type in the Sentry UI.
Next we see options for alert frequency and notification settings. For now, we select the default alert settings, name our project, specify the Sentry team (if you have one) and then Create Project.
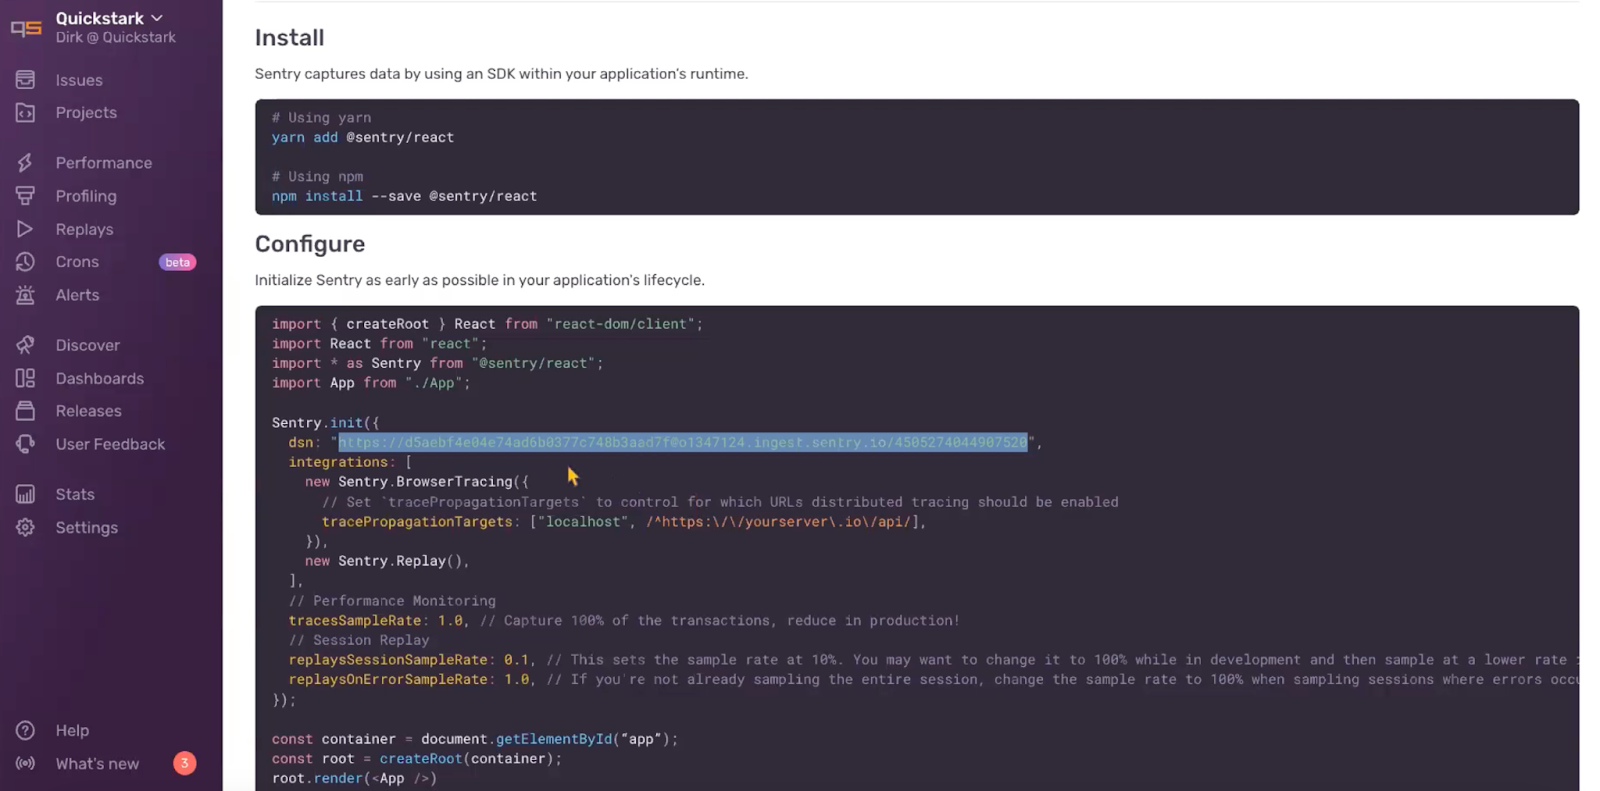
Next we see a configuration page with yarn or npm package installation for our project and the basic configuration details for the selected platform. Underneath the init command, we note our DSN. This is a unique identifier that tells Sentry where to send the events generated in our app. Now when we click on the Projects tab, we see the name of our newly created project.
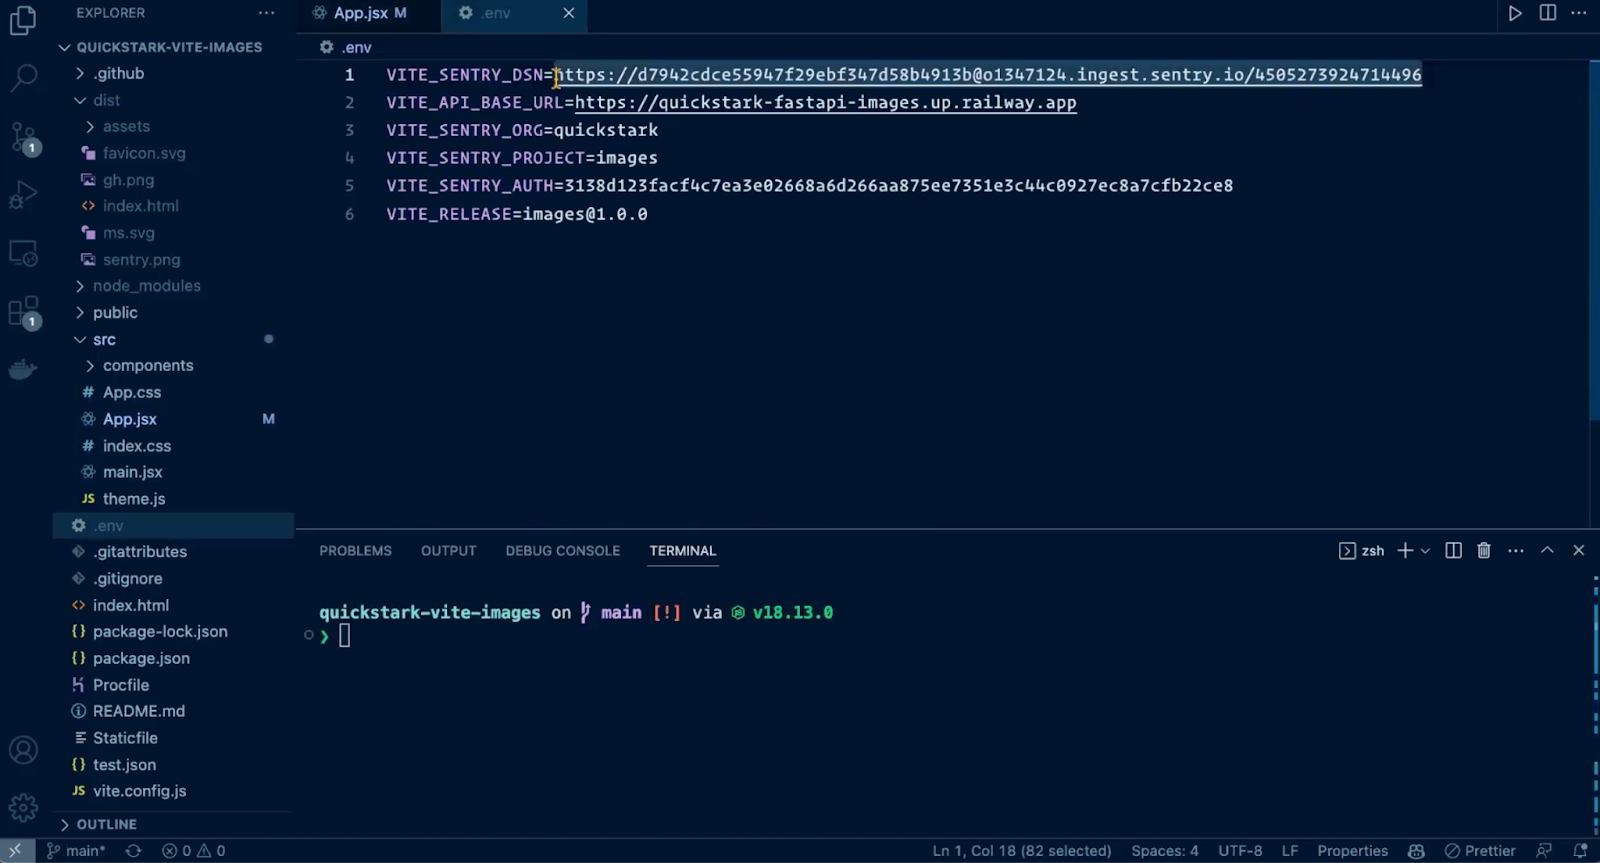
Next we head to the IDE, pull up our project, and drop the Sentry DSN into our environment variables, and add the Sentry init. And just like that, Sentry is ready to start capturing errors. We are using the default configuration settings, which means we are also sending Session Replay and Transaction events. Later on we’ll briefly explain how sending these two event types can help us debug errors.
Now we’ll run our dev server to preview the app. The React app is a simple gallery where we upload an image and use Amazon Rekognition to detect text and what the image is about. We’ve designed the app so that when we click submit, an error is submitted to Sentry and what was detected by Amazon Rekognition is sent as a tag that is attached to the error sent to Sentry.
If you are new to Sentry, think of an error issue as a group of individual errors with the same underlying issue. To view the triggered error, we go to the Issues tab. In the example error we threw in the screenshot above, the first tag was machine.
To search for issues with this tag, we enter “Keyword-0: Machine” in the search bar. When we select an issue, we visit the issue details page and see a lot of information about the error, (e.g tags and breadcrumbs), but our stack trace is missing. To start seeing a readable stack trace, we need to tell our Sentry GitHub configuration where our source code is.
Note: While the proceeding source map upload instructions are still relevant, the new source maps upload wizard can help you upload source maps with a single-line of code. Additionally, the wizard will auto-inject the variables into your JS bundler config. You will need to ensure those variables are in your CI/CD tool when you run the required product build script.
Since we’ve already connected GitHub to Sentry, from the GitHub Integrations tab, I select the Configurations tab and then Configure for my account to see a list of repos already connected to Sentry. However, to connect my source code repo to Sentry errors, a few more steps are needed. On the Code Mappings tab we tell Sentry which repo maps to which Sentry project. When we select Add Code Mappings we enter our GitHub and project info. Note that your Stack Trace Root may differ by environment.
Now we go back to VSCode, to send our source maps to Sentry. In the vite.config.js file Sentry has a plug-in where you’ll see the environment variables we want to target. We also have plug-ins for Webpack, Rollup, esbuild and more, or you can upload them using the CLI. After building our project, artifacts are assigned to a specific release, along with the token that uses the API to upload source maps, and some other source map configuration we could define. The Sentry Vite Plug-in will then find all our source maps and corresponding source code to send to Sentry.
Once we run the preview, we can then head to the browser, trigger an error and go to Sentry to see the new issues.
After firing another error from the app, we go back to the Issues tab and select the most recent issue. Right at the top of the issue details page, we see a Suspect Commit banner. Sentry has identified the release that introduced the issue in question. It’ll even tell us who introduced the commit, and use GitBlame to tell us who introduced the exact line of code in question. In the top right you can manually assign someone to the issue or you can upload a CODEOWNERS file to automatically assign issues to the people who introduced the commit or line of code that threw the error.
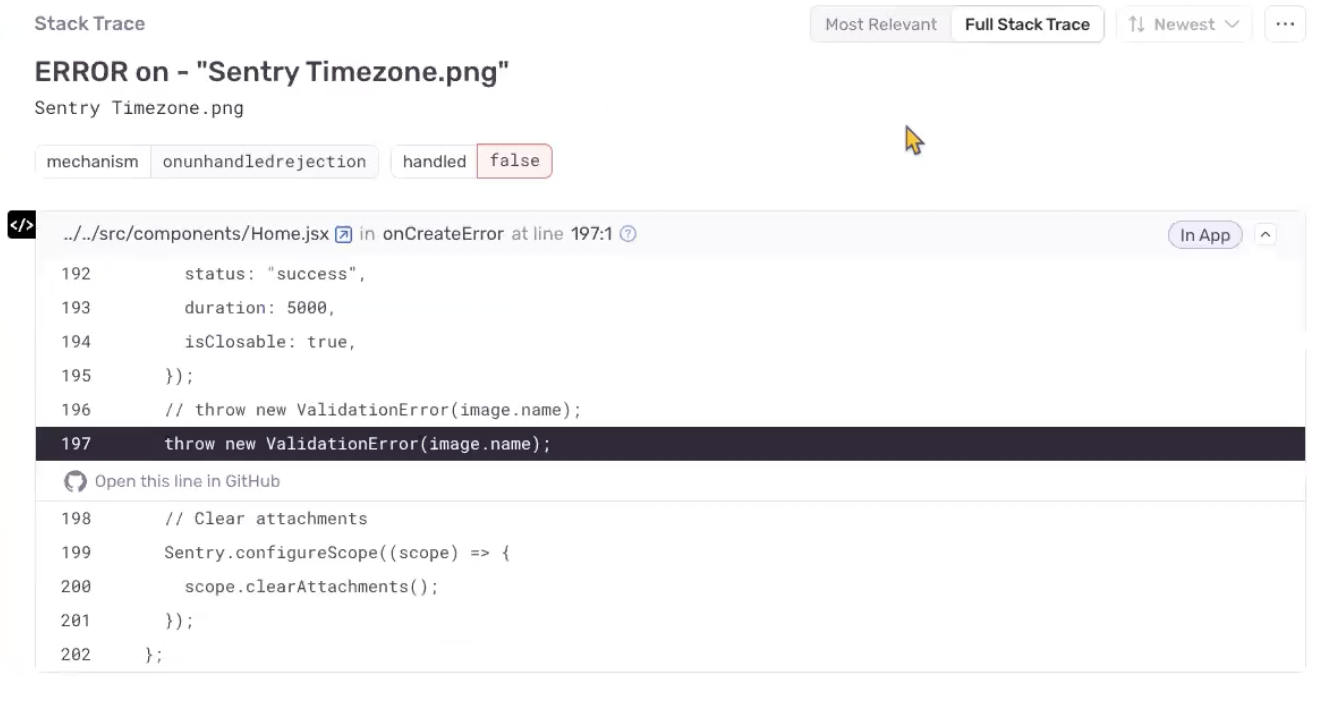
Further down the page we can see an un-minified stack trace. The exact line of code we used to trigger the error is highlighted, and the line of code is linked to in GitHub.
When we set up the project, sending events for Session Replay and Performance was enabled by default. Underneath the stack trace, in the Breadcrumbs section, we can see that a video-like reproduction of the user session where the error occurred is available. We can open the replay to see everything that happened during the session, along with related errors, breadcrumbs, tags and even search by DOM elements (aka where users clicked or navigated). Since Performance events are also being sent and we already had Sentry instrumented for our backend, when we select the Trace tab, we can see how spans in the backend and frontend relate to each other.
This post walked through how to get started with JavaScript error monitoring in Sentry. We covered how to connect your source code to Sentry to view un-minified stack traces, how to see video-like reproductions of errors with Session Replay, and how tracing can help you see how spans in other projects relate. However, there’s a lot more to Sentry than errors.
As our project is currently instrumented, we have access to data related to Releases and Performance within Sentry. We could see how a specific release is trending (e.g. crash-free and failure rate for user sessions), and identify new or regressed errors. With Performance for our frontend project we could see a list of slow transactions, Web Vitals, and other latency and throughput related metrics. Additionally, if we were to go back into Sentry and set up custom Alert Rules, Sentry can notify us via messaging platforms like Slack, Teams, or PagerDuty when app performance starts degrading, issue frequency increases, a new release is deployed or on a host of other metrics/issues. By using other Sentry features, you can get an even richer profile of overall application health. Sentry can’t stop your app from erroring, but it can tell you when something goes wrong, and give you insights to understand why it happened and how to fix it.


